I’ll cut to the chase first. I have no inside information, but my analysis has lead me to conclude that Blue Apron is acquiring customers at a rough CPA of $150, its current monthly churn appears to be ~10%, and the Company eventually nets ~$150+ of contribution margin over the lifetime of an average customer.
Those numbers aren’t written in their S-1, but the analysis used to come up with them is based entirely on the information provided in that S-1. No one else, as far as I have found, has published them. I frankly haven’t seen even educated guesses at specific numbers. Other than saying that the current number is probably higher than the $94 figure they disclose in their filing – but that number is based on the average of 2014 through early 2017 results.
For background, I helped to build the analytics team at Beachbody, then ran media and customer acquisition there for the last 5 of my 8 years. I’ve since spent the last 2 years helping my clients use information to dramatically improve their customer acquisition and retention efforts. This isn’t an entirely new area for me. And certainly, if someone or the Company proves me wrong, I’ll be the first to acknowledge it.
My goal here is to show how you can dig through information that may not be explicitly detailed and how I got to my conclusions.
More important than what the numbers they shared reveal is what the implications are for their own business as well as others in the meal delivery space, and the broader subscription business. More on these points in a bit.
What Blue Apron Shared
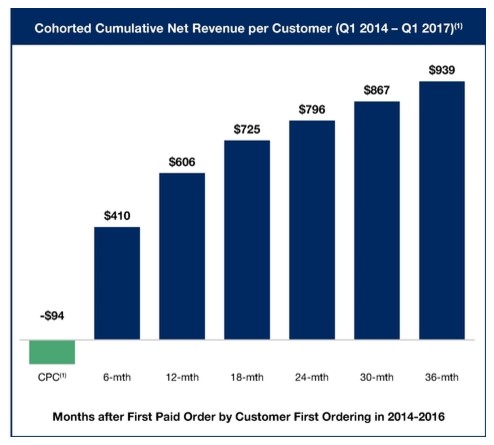
The below graphic is the one that has been making the rounds. It is pulled out of their S-1.
Chart #1
What the graphic shows is the average cost to acquire a customer during the 2014 to early 2017 period. I’m not sure why it’s called CPC (“Cost per Customer”), but it’s more normally called CPA (“Cost per Acquisition”). In addition, it shows the lifetime revenues for customer over various periods after their first paid order. Since the date range considered is 2014 to early 2017, but we are only in mid-2017, the metrics shown for 30 months out and beyond are based on customers in the earlier part of the range.
Let’s also not gloss over the clearly very intentional label, “Months after First Paid Order.” One frequently-used component of Blue Apron’s customer acquisition strategy has been to give away meals and/or the first box. That language is specific, such that if a customer doesn’t pay for the first box, they are excluded from the lifetime revenues part of the table.
As for the Marketing Expense associated with these free boxes, there’s this language from page 67 of the S-1 – “Also included in marketing expenses are the costs of orders through our customer referral program, in which certain existing customers may invite others to receive a complimentary meal delivery…The cost of the customer referral program is based on our costs incurred for fulfilling a complimentary meal delivery, including product and fulfillment costs.”
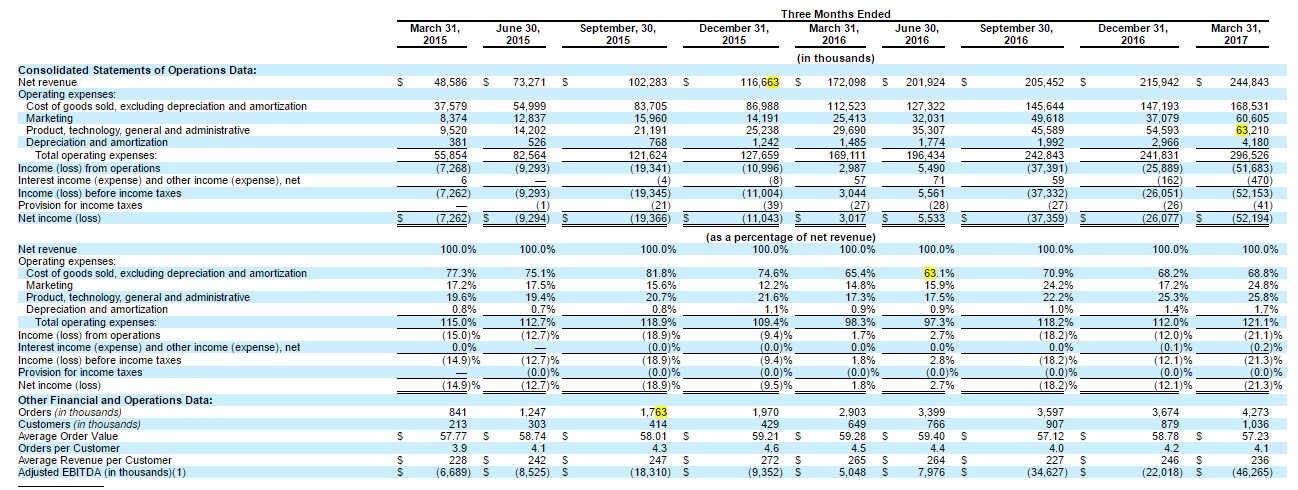
Next, the below is another table they presented. It’s an eye-sore for everyone, but has some valuable information in it.
Chart #2
Here is a view of the more telling parts of this table.
Chart #3
Based on Charts 1 and 3, we have the information to calculate their acquisition cost and churn.
I’ll start with churn:
The first line is provided in Chart #1. The second line is just the difference from one period to the next. Now, the estimated retention is based on the following:
- From Chart #3, it looks like the Average Revenue per Customer is roughly $247 per quarter. I’ve had to make some simplifying assumptions – this number is a simple average – not perfect but likely close enough.
- $247 per quarter implies $494 per 6 month period. So if in the period from 6 months to 12 months in, customers generated an incremental $196 of revenue, then that implies that Blue Apron only has 40% of them left ($196/$494). This is the calculation behind the 40% figure in the 12mo column. The same math is used for the rest of that line.
- Dropoff – this is the percentage point difference from the prior period – Note that I haven’t shown Day 0, which was the starting point, to calc the 17% for the 6mo column.
- A couple things jump out, whether from the Estimated Retention Line or the Dropoff one.
- Somewhere between month 6 and 12 is where the 50% figure is crossed, which helps to give a sense of the average stick rate of customers
- Estimated retention seems to go up from month 30 to 36. My guess is 2 main factors are causing this: a) we don’t have the exact same cohorts in the analysis, only what was available when the S-1 was put together, so it’s not pure apples-to-apples; and b) I’ve made simplifying assumptions based on Average Revenue per Customer, but I would guess that those customers who have stuck around 30 and 36 months have higher-than-average quarterly revenue.
To get a bit closer to when the 50% threshold is crossed to give a sense of the average retention rate (at this volume, I think it’s fair to say that the mean and median are approximately the same), we can do some additional analysis.
Using a straight-line average of dropoff – use the figures at 6 and 12 months as the starting and ending points, respectively, we can generate this table:
From there, it looks like somewhere around month 10.5 is when the 50% figure would be crossed. If the average customer sticks around 10.5 months, that implies monthly churn of roughly 100/10.5 = 9.5%.
This figure is going to be supported as I get into the CPA calculation. But one other way to back into that churn rate is to take the Company’s reported $939 of lifetime revenue, and divide it by the simple average revenue per customer, which I’ve calculated at $247 (per quarter). That implies 3.8 quarters that a customer sticks around, or 11.4 months.
The simple average of these two calc’s would be 10.5 months. I’m discounting a bit for scale to get to my 10% figured.
Couple additional points here – the average lifetime revenue from those cohorts in the 36mo column will go up. They’ve simply reported the data they have now. So arguably LTV will only get better, but at the same time, as the Company attracts a broader group of customers, that’ll be counter-balanced with lower-quality customers. We can argue about what retention plans they have in place, do people get stickier to the service, etc., but for now, let’s assume this is all a wash.
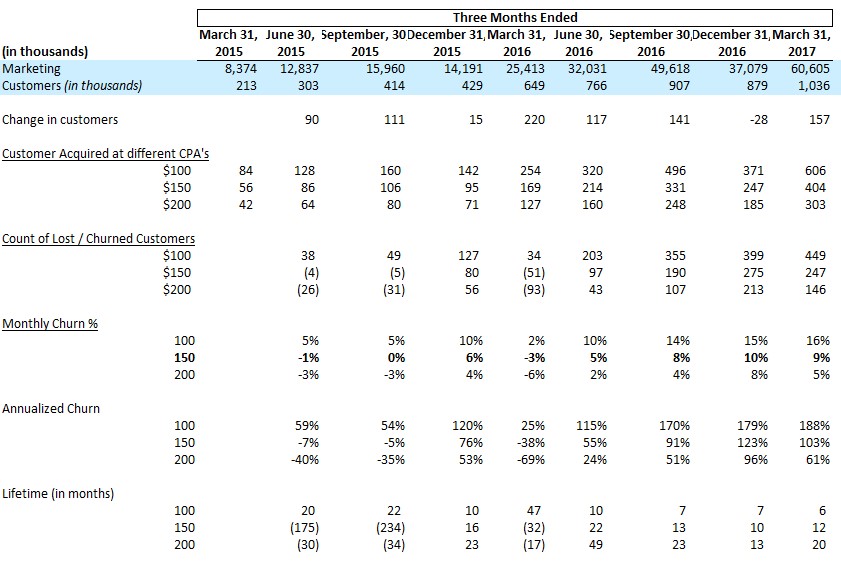
Now, to calculating the actual CPA Blue Apron is running at
The top part of this table is from Chart #3, the rest is the analysis based on it – my explanation of the table is below:
Change in customers is simple math – the net change in customers from the end of the prior period to the end of the current period.
The next section – Customers acquired at different CPA’s – shows the number of customers acquired based on the Marketing spend reported by the Company and based on varying CPA’s. Since the average from 2014 through early 2017 is $94, I’ve made the assumption that the Company CPA has been increasing over time – not unreasonable at their scale. I’ve just used simple $50 increments after trying out a few different ranges.
For example, for Q1-2017, based on $60MM of Marketing spend, and at a $150 CPA, that would imply 404K customers who joined during Q1.
Based on these figures and the net change in customers (to repeat, a calculated figure based on the table), the Churn section is then created. At $150 CPA, that would imply the Company lost over 247K customers during Q1-2017.
Monthly churn is based on the average of the prior and current period figures, adjusted for the fact that those numbers are quarterly. Again, sticking with the Q1-2017 and $150 CPA figures, that would imply churn of ~9%. I’ve simply multiplied the monthly figures by 12 to show annualized numbers. Anything over 100% describes a scenario where the Company is essentially turning over its entire customer base each year. We know that in actuality that isn’t the case – there are clearly some customers who have stayed on for a very long time, but it’s a helpful way to make sense of those over 100% figures.
Finally, Lifetime in monthly is calculated based on the Churn percentages – the opposite of what I did in the original churn analysis.
Which assumption on CPA is correct?
If we assume a lower figure, that means that churn is higher. And vice versa.
But if we layer on the first analysis here, and use the “starting point” of ~10% churn as a possible figure, that leads us to look at the $150 CPA line. Note that during Q4 of 2015 and 2016, the Company lost a lot of customers, which isn’t unexpected given the holiday season. Even with the Q1-2016 figure, as much as CPA doesn’t stay constant, the 10% churn figure and $150 CPA seem like defensible metrics for the business based on the information they provided.
Many folks have commented on the fact that Blue Apron didn’t explicitly reveal its churn. But I wanted to share that it’s possible to back in to that figure.
As for the $150 CPA, it seems reasonably that the current CPA is ~50% higher than the average over the past few years. At their volume, that isn’t unexpected, not to mention, they are going after more mainstream customers, as opposed to the early adopters. That usually means spending more to reach those folks. Finally, competition has increased – everyone like pure competitors such as Hello Fresh and Plated, as well as additional options like Munchery, Uber Eats and even Door Dash – have no doubt made customer acquisition more costly for Blue Apron.
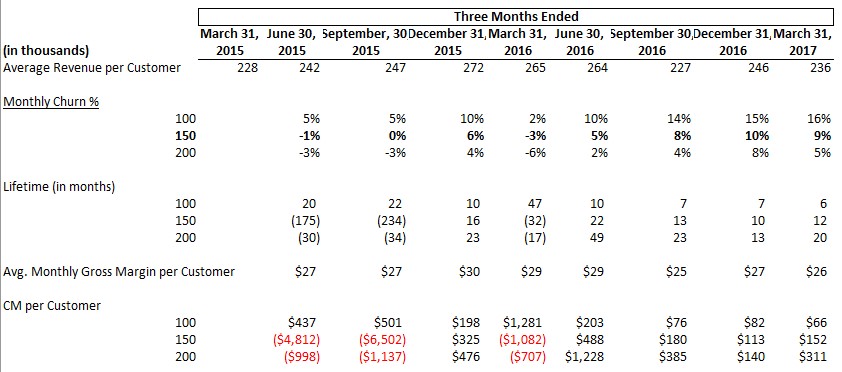
What this really means for the business, and how much does the Company make on each customer:
Using the average revenue per customer, alongside the disclosed cost of goods, the Company makes roughly a 33% Gross Margin on its revenues (Revenues less Cost of goods, which include product and fulfillment expenses). Adjusting the quarterly revenue per customer to a monthly basis, the average monthly gross margin per customer is ~$26. (Note, at a $150 CPA, that implies 6 months to breakeven on a customer, which is exclusive of all of the Company’s additional expenses such as G&A, capital expenditures, etc.) If we then multiply that margin figure by the average lifetime, we get a lifetime gross margin, which when reduced by the acquisition cost, gives a lifetime contribution margin (“CM”) per customer. At a $150 CPA, the Company is roughly making $152 per customer.
Implications for Other Businesses
For starters, Blue Apron has significant funding – almost $200 million according to Crunchbase. That has allowed the Company to operate at a significant loss for pretty much the entirety of its existence. Many of the other larger food delivery companies are in a similar situation, though the vast majority of companies at large don’t. In addition, operating in the red on a per customer basis for 6 months+ is more taxing than most companies can afford.
It’s also tough to run a business when 10% of your customer based is cancelling each month. Those are figures reminiscent of my days at Napster in 2006, when the iPod was the hot thing and subscription music was widely criticized as a non-starter. (This was also the period when Blockbuster came out with its competitive product to Netflix, and everyone “knew” that was the end of Netflix. I think we’ve all seen how that worked out.)
10% monthly churn is really high. As I mentioned earlier, that equates to turning over your customer base more than once a year. Which puts dramatically more pressure on customer acquisition. And while the company only has tapped 2-3 million total customers (I’m again making some simplifying assumptions), which is 1% of the US population, with rising competition, it makes its model more difficult. Not that I’m betting against them necessarily. More just looking at what their metrics seem to indicate.
Net net, this is a tough business. The margins aren’t great, customer acquisition isn’t cheap, and retention is unlikely to jump from 10 month to 20 months in the near future.
Something would need to change for their model to dramatically improve. With these dynamics, it’s not just a “we’ll make it up on volume” play. But to the extent one or more of those components – core margin, acquisition cost, or retention – could change markedly, the model could be different.
The only one of these metrics that was likely reasonably understood early on was margin. Until they (or anyone else) began testing, acquisition costs and stick rate were really unknowns.
Which go to the larger point for other businesses, whether in the same or other categories, and that is about how to get as quick an understanding about the business fundamentals and dynamics as possible.
To be clear, there are plenty of subscription businesses that are thriving, both in the food category and beyond. This is absolutely not a criticism on the category – and frankly it’s not a criticism as much as it is a deep analysis on the Blue Apron business itself.
Every business has to manage through the relationship of Customer LTV and Customer Acquisition Costs. And then must layer on constraints such as cash, risk it is willing to take, and business objectives – in determining the better path to proceed down and what strategic decision it wants to make as it evolves.
That is the challenge and the fun of forging ground in new categories.
I, for one, am certainly very interested to continue to watch Blue Apron along its own path.







Fantastic post.
Thanks Paul.
Was wondering if I could get some clarification.
“If the average customer sticks around 10.5 months, that implies monthly churn of roughly 100/10.5 = 9.5%”
What is the 100 and how does this imply a monthly churn? Should this be 50 as it has only cut down by half? Thanks!
It’s just the math based on 100%. For every 100 people who join, if they are gone in 10.5 months, that implies the 9.5% churn rate. Or you can back into it as well to confirm it. If 9.5 percent of a starting group churn out each month, it’ll take 10.5 months for them all to be gone. Obviously, it doesn’t happen this way. This is just to get an average value. Hope that helps.
Great analysis. Will be keeping an eye out for that IPO.
Thx.
Fascinating work. Good on you.
Thanks.
I was sent here via our mutual friend, Jenny Thompson. Great read, Babak. Thank you for the details!
Glad you found it helpful Casey.
Jenny and I have known each other for a bit now. Good stuff.
-Babak
Blue Apron customer acquisition costs seem to be a hot topic. Other sources are calculating implied CAC as high as $460, can you point out what incorrect assumptions they are making to get to their figure?
Hey Dan,
If you can share what sources you’re referring to, that’ll help. Without knowing if they are saying all-in CAC or potentially for a given channel or during a certain time period, I don’t know how best to respond to your question. If you can share the article links, I’ll take a look and will let you know as best as I can.
Thanks.
-Babak
Sure, was not sure you wanted me posting outside links:
“If you want a more recent number like, say, over the last 12 months, you get cost per customer of around $460 — not $94 — if you divide marketing costs over that timeframe by customers added during that period. Whoa!”
https://www.recode.net/2017/6/1/15727182/blue-apron-ipo-s1-analysis-customer-acquisition-marketing-churn
Another blog post referencing, and refuting the Recode article:
“For example this Recode piece incorrectly infers Blue Apron has recently been spending >$400 to acquire each new customer. The error is that “Customers” as reported in the S-1 is basically active customers (e.g. how many people ordered in a particular quarter / year), not cumulative customers added.”
“The punchline is a 3-year LTV/CAC of 3.1x. Basically present gross margin of 31% and cumulative 3-year revenue of $939 and CAC of $94. You can look at my underlying math in the Google spreadsheet embedded above (LTV/CAC tab)”
https://medium.com/startup-traction/blue-apron-s-1-meals-on-your-doorstep-923499bcaf45
The second article does not attempt to identify the implied/current CAC and just relies on Blue Apron’s $94 figure, which I believe makes the rest of the article and the calculations performed somewhat meaningless since they fail to take into account the upward trending CAC.
Thank you for your thoughtful responses.
Hey Dan,
Appreciate the concern about outside links, but not a problem.
That first article by recode just seems weird. It looks like they took the last 12 months’ marketing spend (approx $180 million) and divided by the NET increase in customers, which is ~390,000. I think that’s how they are getting the $460 CPA figure. But it of course doesn’t capture total new customers nor the impact of churn.
The second piece just seems to take the numbers straight out of the S-1. I don’t have any issue with that post nor the Google Doc. He’s just laying out the numbers the company has given.
Given that the $94 was an average across a long period of time, my piece was meant to show what I believe the current Cost per Acquisition is. That’s also why I showed a few different scenarios on CPA and churn – I don’t know for sure, but making some reasonable assumptions and going thru a few scenarios, the $150 CPA figure is the most believable given the information that they have shared.
Hope this helps.
-Babak
What do you make of Blue Apron’s claim in the S-1 that 92% of revenue is derived from “repeat orders”? Is there a way to verify this using figures provided elsewhere? Is this a useful metric in their business or a vanity metric?
Thank you for your thoughtful analysis.
Hey Dan,
I actually might’ve thought the percentage would’ve been higher. Given that they say their average order value is $57 (for Q1-17), and the Lifetime Revenue is $900, that would imply an even higher percent. They also have run a decent number of promotions discounting that first order (my guess is the $57 is gross, not net), so another argument for a 90%-95% repeat order figure. At the same time, they have some additional non-plan revenue sources (wine, kitchen gadgets, etc.), so that probably helps to bring that percent in line with what they are saying. Net net, the info they share in the S-1 seems to support that figure pretty clearly.
Thanks for the question. And hope that helps.
-Babak
I think this analysis is completely incorrect. Average order of 4.1 per customer implies average retention of 1 month. The potential for a three month period is 12 orders. Their churn rate is significantly higher than your analysis indicates and is likely closer to 40%. Their COGS is way too high and the CAC will not decline rapidly enough to save them.
This industry has trained customers to move between offerings due to heavy first and recapture discounting. This business will never make money. The only way to survive will be through consolidation among the large companies.
Hi Ted,
I appreciate your taking the time to read and to comment. A few thoughts:
1. For starters, we have to take what they’ve provided, and knowing that they have provided reporting over an extended period of time. So we’re looking at average across multiple cohorts.
2. I think it’s possible that churn rates, whether for new customers (2016/2017) or when looking at customers in their first month or two, are as high as 40%. To say that churn across the entire customer base is 40% would imply that their CAC is ~$50. I’ve didn’t show that scenario in my analysis for two reasons:
a) Based on what I’ve seen elsewhere, that felt like too low of a CAC for them to achieve at the scale they are at (and certainly to the extent their definition and mine are different, for example, around reactivation, that might also contribute to some differences)
b) Based on how they show LTV increase over time – chart 1 in my post and page 63 in the S-1 – it seems like they have roughly 40% of a cohort after 12 months. Another explanation is that those who do stick around have an average revenue per box/month significantly higher than the average. Entirely possible.
Taking only that 4+ orders per customer per quarter, that’s more like 30% churn, which implies a $60 CAC. Again, possible.
This is why I wanted to show my work so that others like yourself who have a different perspective could provide it.
3. As for COGS, this is the nature of the food business. It’s high for everyone and I don’t think that’s changing anytime soon – though we’ll see what Amazon decides to do through the Whole Foods acquisition. Even then, the traditional grocery model is in the long single digit percentages (Whole Foods has been ~3-4% for the past few years), so Bezos’ “Your margin is my opportunity” approach doesn’t have that much room unless he wants to go negative.
4. You’re right about training customers, which is why discounting can be such a dangerous model, even though it helps to pull in customers. Certain models can work with discounting, others can’t. And that’s part of the bigger point of my post – which was to show that you can dig into these types of docs and try out various scenarios, as well as to use that to better understand different businesses to make sure that a more robust business model is present.
5. Finally, I believe consolidation only works if there are true synergies, which usually means layoffs and dramatic efficiencies and cutbacks to capex. I think there are still big challenges at 3x the revs. Time will tell.
Once again, thanks for your comment. It forced me to layout a few additional points that I previously hadn’t.
-Babak
Great find and analysis, Babak.
Thanks!
Thanks David!